This is a virtual DEC PDP-1 emulated in HTML5/JavaScript running a graphics demonstration (AKA "display hack") by David Mapes, who worked at the Lawrence Livermore National Laboratory (LLNL) in the 1960s.
Artwork and PDP-1 emulation by Norbert Landsteiner, www.masswerk.at, 2012–2022.
Based on emulation code by Barry Silverman, Brian Silverman, and Vadim Gerasimov. The original code was extended to support some additional instructions and auxilary hardware. Moreover, the shift/rotate instructions and the arithmetics were rewritten (include an emulation of the hardware multiply/divide option), and cycle counts were added for accurate timing and frame rates. Some importance was put in the recreation of the appearance of the original CRT display and the unique experience conveyed by it.
The emulator was originally conceived for running Spacewar!, the earliest known digital video game.
Play it here: www.masswerk.at/spacewar.
For further early 1960s display hacks for the PDP-1 see: www.masswerk.at/minskytron.
In a recollection (see below) of his work on the PDP-1 at the Lawrence Livermore National Laboratory (LLNL) David Mapes describes a graphical program, which independently combines features of the better known MIT Display Hacks, like the Minskytron or Snowflake. Moreover, the Statement by David Mapes also documents an independent invention of a circle algorithm, which is commonly attributed to Marvin Minsky. (While Marvin Minsky found the algorithm by accident, David Mapes arrived there by design.) Last but not least, the statement suggests a cultural significance of these early graphics demos and an impact on the pop culture of the late 1960s, which may have been widely underrated.
The program described in the statement is here presented in four variations, once as an 8-points display, mirroring a moving point along the 4 major axis as described by David Mapes, once as a double point display, once displaying just a single point as represented in the listing quoted below, and finally as a hyperbolic 8-points display (where c1 = c2) as mentioned by David Mapes as well.
The general algorithm is
loop:  y := y + x * c1
       x := x + y * c2
       display(x, y)
       c1 := c1 + 2-18   (incrementally loops over range -1 < c1 < +1)
       c2 := c2 + 2-18   (incrementally loops over range -1 < c2 < +1)
       repeat
with starting values for c1 and c2 for a circle-based variant ( 0 < c1 < 1 and c2 = −c1 )
       c1 =  1/8
       c2 = -1/8
(Note: The PDP-1 uses 18-bit words and 1's complement notation for negative values. Values used in multiplications are considered signed fixed-point values smaller than 1. The Type 30 display has its origin [x = 0, y = 0] at its center, thus display coordinates, considered signed integer values with only the 10 highest bits significant [-512 ... 512], are mirrored by overflow.)
The source code for the PDP-1 "Macro" assembler used to produce the binary programs can be found here.
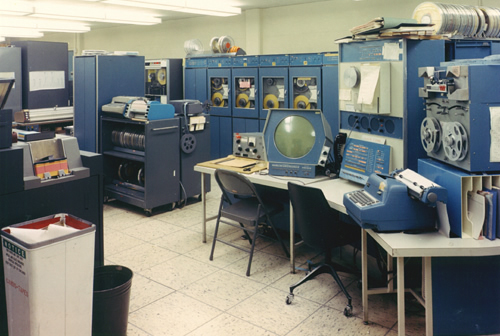
The DEC PDP-1 at the Lawrence Livermore National Laboratory, ca. 1964.
Via the Computer History Museum (accession 102618910).
“One day when Roger Fulton was leaving for home, he said that what would really impress him would be if he could come back tomorrow and find a circle displayed on the TYPE 30 CRT. Later that night, I lay in bed thinking about this when it occurred to me that subtracting a fraction of the current y value from x and adding a fraction of y to x would create the next point on a circle. I strained to visualize this for different values of x and y. It would hold for the 8 values at each 45 degrees but it was hard to visualize other values. I jumped from bed and headed for the lab and the PDP-1. I arrived around 2:00 am and wrote a small program that would do arithmetic shifts to divide x and y by 16 and compute x = x + y/16 followed by y=y-x/16 then display the resulting point and repeat the process. And there it was: a circle on the display. I was so excited that I started playing with it, adding to the program, generating ellipses, and didn't leave the consol of the PDP-1 until 2:00 am the following morning. Needless to say, when Roger arrived, he was impressed. By the time I got back to the lab the following day, Chuck Leith met with me and gave a complete description of the algorithm with details about the maximum deviation from a perfect circle and how to determine the number of points needed to complete a circle. I was impressed that he could come up with so much information about this and in such a short time. Later, it occurred to me that Chuck Leith and I should have published this work. Shortly after that, George Michael made me aware that I had rediscovered what was discovered long ago.
The following is this program using multiplies instead of arithmetic right shifts. It is written for a PDP-1. It uses two variables, c1 and c2, for the multipliers, where c1 = -c2, so that no subtract is done. This is done to provide the ability to generate different conic sections without changing the program.
Variables with initial values
- x= 0
- y=+32 = Octal 040000
- c1=1/8 = Octal 040000
- c2=-1/8 = Octal 737777
- For a circle c1 = -c2
- For an ellipse c1 is not equal to c2 and the signs must be different
- For a hyperbola quadrant the signs c1 and c2 are the same but the magnitudes can vary.
Program
Loop:       Lac  y
            Mul  c1
            Add  x
            Dac  x
            Mul  c2
            Add  y
            Dac  y
            Lio  y
            Lac  x
            Display point (x,y) on CRT: no need to wait

For visual effect
            Idx  c1
            Idx  c2
            Jmp  loop
I used variations of this program in conjunction with other graphic algorithms to create many animated graphic displays. There was a routine that would take a point x and y and create seven more points:
- P(-x, y)
- P( y,-x) swap x and y
- P(-y,-x)
- P(-x,-y) swap x and y
- P( x,-y)
- P(-y, x) swap x and y again
- P( y, x)
Displaying these eight variations for a list of points creates a kaleidoscopic effect on the display. A program called Snowflake used this routine and was passed around to PDP-1s around the country. DEC's president Ken Olsen got a copy when he visited the lab and took it back to headquarters in Maynard. I've seen several PC screen savers using this eight-point reflection technique.
A collection of these programs was used to create a film. An offline 16mm camera was used to capture the images on the TYPE 30 CRT. (…) This film and others made using the PDP-1 at Stanford University with rented cameras were shown to various advertising executives, TV stations, the ABC and NBC networks, and the rock group, Pink Floyd. One of these films, with editing and added musical sound track, was shown to the weekly meeting of the Motion Picture Academy of Arts and Sciences in 1968, to an audience of several hundred movie professionals. The idea of computer animation had not reached the grasp of the mainstream, and I was young and scared. One of the most terrifying moments I have ever experienced was standing on the stage in front of these 200 or so movie professionals with my knees shaking, trying to answer questions from the audience and not thinking that they were understanding me.
The Stanford PDP-1 had a character generator that could be used to generate parts of large characters. Each character was formed by nine parts. These parts were lined up properly to form a message. Next, the nine parts of each character were programmed to fly apart in circular patterns. The off-line camera was activated and the parts were made to retrace their paths back to their start, forming the message. This was actually accomplished using a Z axis to define the corner point of each character part in 3 dimensions. When Z reached the vanishing point for a part, it came to rest at a point x,y. The part was theoretically still spinning around in an x,y plane, but so far away it didn't move. The effect was good. Parts would fly around in circles rapidly at first and then slowly come together. A separate Z coordinate was used for each part, such that the parts appeared to arrive at their destination at different times. Many of the programs used three dimensional coordinates. The three coordinates were projected onto an x,y plane or were used by a simple method: Display x = x * z and display y = y * z where 1 > z > -1.
A copy of Marvin Minsky's Minskytron made it to the lab during the time that films were being made. I included a film segment of this in one of these films giving him credit whenever it was shown. George Michael mentioned that Marvin Minsky had also used the same method to create the circle program.”
David Mapes in "A Statement from David Mapes", www.computer-history.info/Page2.dir/pages/Mapes.html.
The DEC PDP-1's Type 30 Visual CRT Display was a point plotting display* with a dual P7 phospor (light blue for fresh pixels and a yellowish green long sustain — think of radar display, this is exactly what the tubes were made for). The display featured a technical resulution of 1024 × 1024 display locations at 8 intensities, but according to DEC documentation only 512 of them on any axis were visible to the human eye. Thus, the low (or standard) resolution of the emulation, rendering at this visual resolution, is closest to real thing. The high resolution versions render the programs at the technical resolution and are scaled down to fit the appearance of the emulated screen.
*) A point plotting display is a random access display, like a vector display, but doesn't feature any memory or line drawing capabilities. Display locations are addressed individually and have to be refreshed by the program. The long sustain of the P7 phosphor helps in keeping the image stable. The spot size of an activated display location was usually bigger than the distance between display locations, thus individual blips tended to merge. Spot sizes also varied by the intensification of the blips, bright spots were bigger than those at lower intensities.
