Network Monitor in Overview
1) Making Networks Accessible
In case you had a look at the introduction to networks, you may have noticed already that even the 3- or 4-step environment of a good networker may be of considerable extent. (Meaning all players who are not more than 3 or 4 steps away from her/him.) While network analysis provides by its visualizations an unequaled instrument to gain a grasp on these structures and relations, the accessibility of these diminishes with the sheer extend of larger networks.
This is where Network Monitor comes into play: It opens a detailed perspective on specific parts of a larger network, as you step out from a focus of specific interest. It provides a virtual close-up of the entire picture.
Moreover: Besides these capabilities to render even complex maps in real time, it provides a set of amazing tools to give you instant information you need: merged views of statistical data and network maps, information the very nature of particular relations , detailed reports at your finger tips –last but not least the opportunity to roam and explore the vastness of the network while picking up new encounters for a closer inspection.
Network Monitor Austria gives you access to the network of the key players of Austria's economy. This is made up by the countries leading corporations and their interlocking boards and directors (in total ca. 2,600 affiliations and 3,200 persons). The records rely on public data from the Austrian registers of companies and has been specially processed by FAS.research.
2) Experiencing Network Monitor
2.1 The User Interface
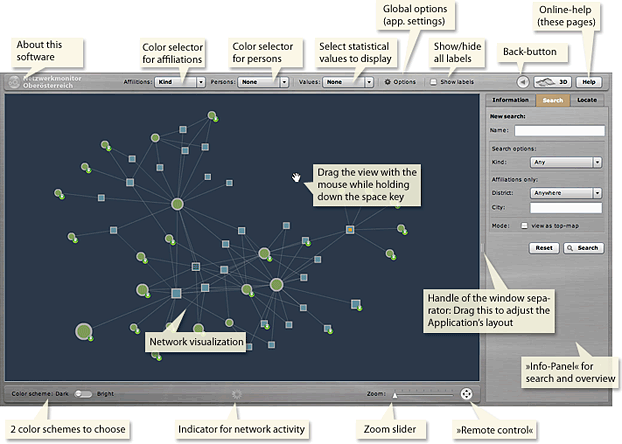
The user interface of Network Monitor is organized in 4 key areas:
| The network view: | The network view is the central part of the application. Here the requested part of the network is rendered in real time. The network view is the main tool for orientation and navigation. |
| The info-panel: | All functionality for search and information has been put together in the "info-panel". It is here, where you start and refine your walks through the network. Just look at it as your personal dash-board. |
| The control bar: | With the control bar at the upper side you control all options of the visual representation. You may switch colors to visualize partitions or blend the visualization with statistical values like the numbers of employees or the companies' turnover. There is even a button for a special 3D landscape mode. |
| The view controls: | Below the network view you find all controls for the view port of the network visualization. Select one of two available color themes, use the slider to zoom in and out, launch the unique remote control. In the middle there is an indicator for network activity, which is only visible when the application connects to the database for data retrieval. |
2.2 A Quick Tour – In 10 Steps Around the World of Networks
All you wanted to know about Network Monitor in 10 steps.
2.2.1 It Always Starts with a Search
As you have successfully logged in, the first you see is an empty network view and the "info-panel" on the right side shows the search dialog. (Should you not see the search box, just click the "Search" tab on top of the "info-panel".)
Enter "asamer" into the search box "Name".
Click the "Search" button or hit the enter key.
The view of the "info-panel" now changes to the result list: In front of every name there is a tiny symbol, a pyramid (for corporations) or a figure (for persons).
Click "Asamer Hans" – the row will be highlighted in color indicating the selection.
Select 2 steps at the bottom of the list and click "Show Selection".
Select the bright color scheme by clicking the theme selector in the lower left corner.
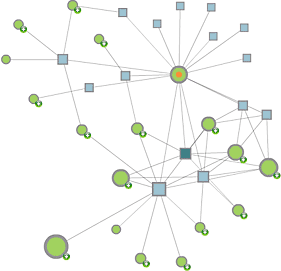
Now you should see this:
Tip: By hitting the "escape"-key (ESC) you may always stop a complex rendering process.
Digression: Some Important Properties of the Search Field
Enter a single or more part(s) of a name into the search box. The search is case-insensitive, special characters and their usual transliterations are equivalent ("ä" = "ae", "ß" = "ss").
The search "knows" the usual wild-card characters "*" (any characters) and "?" (any single character).
The asterisk (star) wild-card modifies the search behavior:
Normally any search terms are compared with any part of the name as stored in the data base. There is no significance of where a search term and the name match. Should there be a asterisk (star) in the search term only those names make valid results that match from the beginning.Moreover Network Monitor provides a phrase search: Just enter a search term in double quotes (").
Examples: sch matches "Scharinger" and "Gesellschaft". sch* matches "Scharinger" and other names beginning with "sch" only. tech matches "Technologie" and "Betriebstechnik". tech* matches "Technologie" and other names beginning with "tech" only. "wolf" matches just the name (or surname) "Wolf".
2.2.2 Orienting Yourself in Network View
One of the unique features of Network Monitor are the reproducible maps: Every time you enter with the same parameters (name and steps) you will see the same image. This allows you to mentally map and recognize players and paths in the network.
The visualization consists of squares (affiliations) and circles (persons), which are connected by some lines (the relations).
The size of the nodes is related to the total count of available connections (degree).
One of the circles is marked by an orange spot in the center: This is the target node – Hans Asamer.
(Since we requested a 2-step environment, the squares (affiliations) are those companies where Hans Asamer is a member of the board or performs as a manager. The other circles are the persons who are institutionally linked to these companies.)
In the lower left you will see a particularly big circle: This one represents Mr. Scharinger, potentially one of the best connected managers of Austria.
Check and uncheck the checkbox "Show labels" (in the top right center of the control bar) to view and hide the names.
Maybe you've already noted that some nodes (squares and circles) have tiny green disks with a plus sign (+) associated to them: This indicates that there are more relations to come. Here you may expand the network.
Move the mouse pointer at the bigger circle at the right center:
The node is highlighted and some other nodes are marked by a yellow center. These are the nodes which are directly connected to the highlighted node. Also the label's of the nodes have become visible. (In case that the labels are already visible, they're highlighted.)
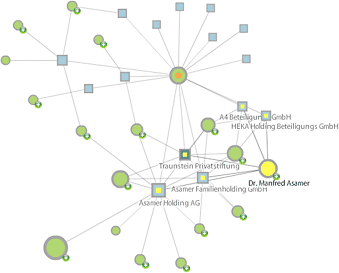
This way you can always inspect the context and morphology of network relations.
2.2.3 Roaming the Network
The node "Dr. Manfred Asamer" bears a tiny plus symbol.
Double-click the node to expand the view by those relations that are invisible by now:
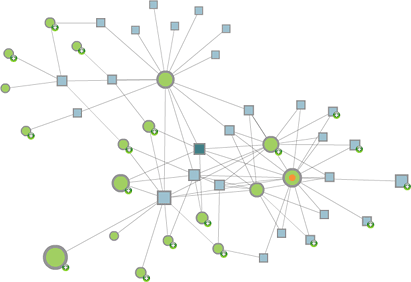
The orange marker has moved to Mr. Manfred Assamer, to show that he's the target of the last action.
At the right periphery a new affiliation has appeared: The "Dachstein Tourismus AG"
By double-clicking this company, some new circles show up: These are the managers and members of the board who work with the "Dachstein Tourismus AG".
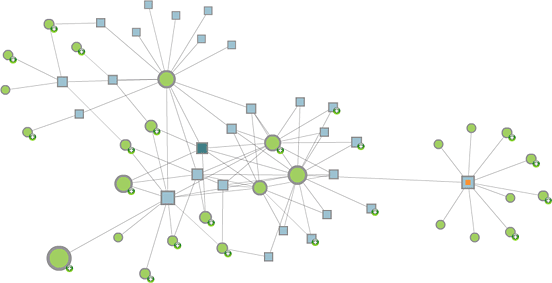
Note: The reverse action to expanding is to collapse a node:
By collapsing a node you delete all neighboring nodes from the view that have only a single visible connection.
2.2.4 Locating Positions and Finding Paths
The picture has now become quite complex. Maybe you don't know anymore, which node was representing Mr. Scharinger.
To locate a person or affiliation – here Mr. Scharinging – switch the "info-panel" by clicking the "Locate" tab. Enter "schar" into the search box and hit enter.
The display changes to a result's list with "Scharinger Ludwig, Mag.Dr." as the single item.
Click this item.
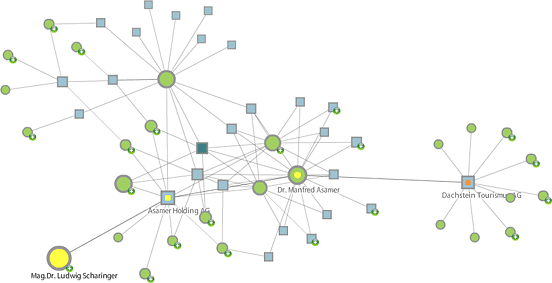
In the network view you'll find Mr. Scharinger highlghited in yellow.
Moreover there are some nodes with a yellow center (and highlighted connections) telling you that Mr. Scharinger is connected with the Dachstein Tourismus AG by Asamer Holding AG and Mr. Manfred Asamer. (There are possibly other connections, but this is the shortest path.)
(The target node marked by its orange center is always the target of any path search. You may change this anytime: Right-click any node to bring up its contextual menu and select "Mark as target element". Usually the target element is the target or center of your last action.)
The contextual menu of any node also bears the item "Reduce map to shortest paths". By selecting this you may reduce the map to a particular context. All nodes that are not part of the shortest path(s) are removed from the current view. Use this option to reduce a complex map to its essential context.
2.2.5 Inspecting Relations and Attributes
As speaking of Mr Scharinger and Mr Asamer: Maybe you're interested in what positions they maintain with the Asamer Holding AG.
Click the Node "Asamer Holding AG"
The "info-panel" display changes to the tab "information".
On the top you see the name of the selected element and the count of visible relations and the total of available relations (the elements directly connected).
Locate Mr. Scharinger and Mr. Manfred Asamer.
Just below their names you'll see the attribute/qualification of their relation to Asamer Holding AG
(So Mr. Scharinger is "Aufsichtsrat-Mitglied" meaning member of the board.)
When you click an item of this list the associated node is highlighted in the network view to indicate its position.
Tip: You may sort the list in alphabetic order or by rank of influence using the sort controls at the head of the list, just as you need it.
2.2.6 Opening a Report
Get detail information on Asamer Holding AG:
Click the little info-symbol in front of the name of the selected element (Asamer Holding AG) or double-click its name.
A window with the report opens:
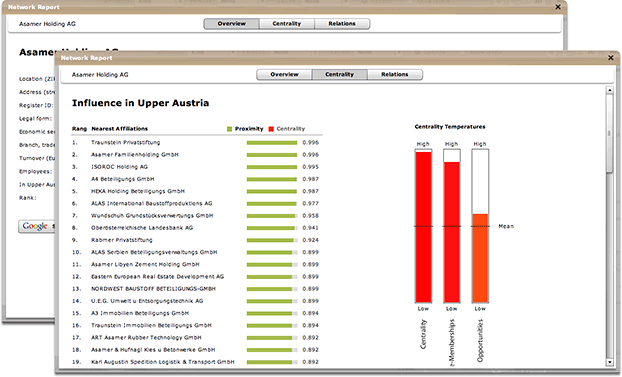
The report consists of different sections: Overview and statistical data, influence, and informations on relations and their attributes.
With according user permissions you may also edit and save notes or print a hardcopy using a specially formatted print view.
2.2.7 Properties and Statistical Values in Overview
Close the report (using the close box in its title bar) and select the search tab of the info-panel.
(Below the search options you'll notice a link to the last search results. Using this you can always switch back to the last results and select different maps to view.)
Search for "uddeholm".
Again select and view a 2-steps environment:
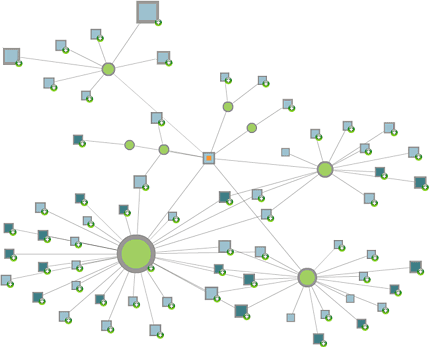
In the network view you may notice some darker squares: These are private foundations.
Select Turnover from the "Values" menu in the middle of the control bar:
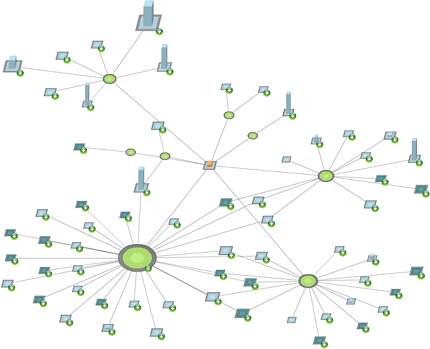
Some corporation now show a chart columns of various hight: These columns represent the relative size of their turnovers.
(Turnovers are only known for those corporation that are bound by law to publish their balances.)
Select Sector from the "Affiliations" menu in the left middle of the control bar:
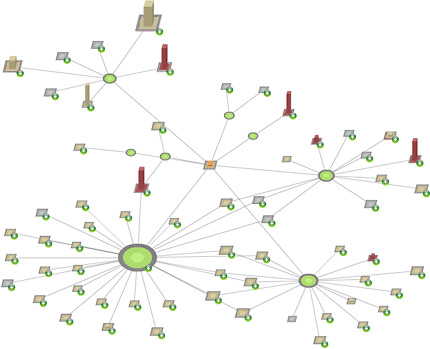
The colors of the affiliations (squares) has changed to show the economic sector the players are in:
The red ones are part of the production industry, the golden ones are in the service industry. (A few are grey: There is no sector information available in the data base.)
All color and value options can be combined freely. The meaning of the color codes can be inspected anytime using the legend available at the lower end of the "info-pane".
2.2.8 In Touch with Networks
As you click and drag an element you may come in touch with the network and its forces.
Depending on the particular weight of the node and the very structure of the network others will follow and react to its movements. This way you can experience intuitively the forces thet govern the network.
Let go of the node and the network will consolidate itself to stable state.
This way you may even sort the nodes by hand (but keep in mind that the network will tend to reorganize its layout according to its forces).
Using a node's contextual menu (right click) you've always a bunch of tools at your finger tips: Modify a view, retrieve a business report, or generate a new view.
Just the same for the various list views: Anywhere you find a name you may switch immediately to a network view, call a report, or search the internet for this particular entity.
2.2.9 Details in Close-Up: Zoom and Scrolling
To reveal even the smallest detail the network view provides a variable zoom.
As you zoom into the map (moving the zoom slider to the right), scroll-bars become visible letting you adjust the visible portion of the network.
Even simpler you may just hit the space bar and drag the image (as you may know it from most image processors). The cursor turns into a hand to indicate that the application is in drag mode.
In case your mouse is equipped with a scroll wheel, you may also use this to zoom in and out while the mouse pointer is hovering over the map. (This feature is not supported for Apple Macintosh™.)
Note: A zoomed view is of great advantage when the option Show labels is selected, to reveal details and provide overview of complex networks in the same attempt.
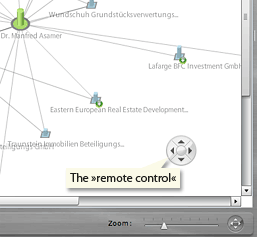
A unique feature is the "remote control":
You employ the remote control by clicking its icon at the right side of the zoom slider.
Now you can click its arrow buutons to scroll the view or zoom in and out while holding the SHIFT key.
(Opposed to the scroll-bars the scrolling speed of the remote control auto-adjusts itself to the current zoom factor.)
You may "carry around" the remote control to keep it in your reach: just click and drag its center to move it around any place you like.
By another click on its icon near the zoom slider the remote controls hides back in its sinking.
Finally you may use the contextual menu of the map's background to switch the zoom or go back to an all over 100% view.
2.2.10 Advanced Operations
In addition to the basic operation described above, Network Monitor also provides functionality for complex operations. By the help of these complex operations you can put your focus on special characteristics and contexts of a network:
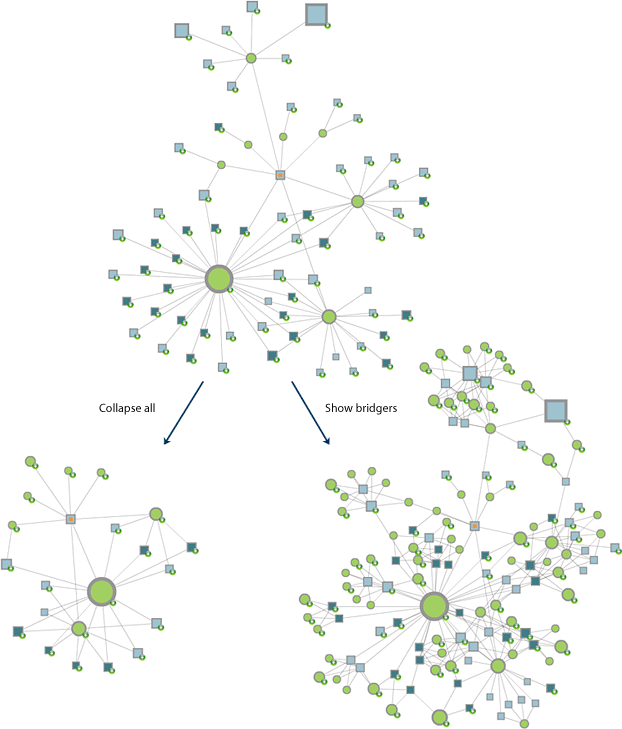
Collapse all
You'll find this option among the items of the contextual menu of the map's background (right click). By selecting this you hide all elements from the view which are currently connected only to another single object. By this you put your focus on the relational aspects of the current view.
Show bridgers
This is another option of the contextual menu of the map's background. This is the inverse operation to Collapse all: You add all these elements to the view which establish additional connections between the visible elements. Now you see what they have in common.
Reduce network
This is an option of the context menu of any node's contextual menu. By selecting this item you reduce the current map to limited range of steps around this element.
(In the illustration above selecting this option for the target element of the right graph would result in the going back to the first map.)
Reduce map to shortest paths
By the help of this you may reduce a network view to the context of a specific relational aspect. Mark any element of the map as target element (using the contextual menu) and select from the contextual menu of another element the item Reduce map to shortest paths. (Cf.: Sect. 2.2.4 Locating positions and finding paths) The network view now shows only these elements that connect the two nodes by the shortest path(s).
Tip: You may step back anytime by using the back-button at the right side of the control bar.
2.3 Things Good to Know About Automatic Reduction of Complexity
Since network visualizations tend to clutter in spite of all endeavors and real time visualizations are quite a load for your computer there are special facilities by which Network Monitor reduces the complexity of the network view:
- There is a maximum extend of the visible environment (dependent on the range and count of visible elements).
As you roam through the network you may notice that there are some elements at the distant periphery that vanish as by magic. As you move through the network you observe it by a focus that limits the range of your view. - By any expansion or retrieval only 30 new neighboring elements of any visible node are added to the view.
Are there more immediate neighbors to an element it'll keep its expansion icon and it is left to another step of expansion to show the remaining neighboring elements.
You may overrule this behavior by double-clicking while holding the SHIFT key: By this you retrieve all available relations by a single step.
There are settings to adjust the behavior of both of these functions according to your likes and needs. Click the "Options" button in the middle of the control bar to call the Options dialog or select Map options from the contextual menu of the map's background.