The PET 2001 Emulator Debugger
A visual tour.
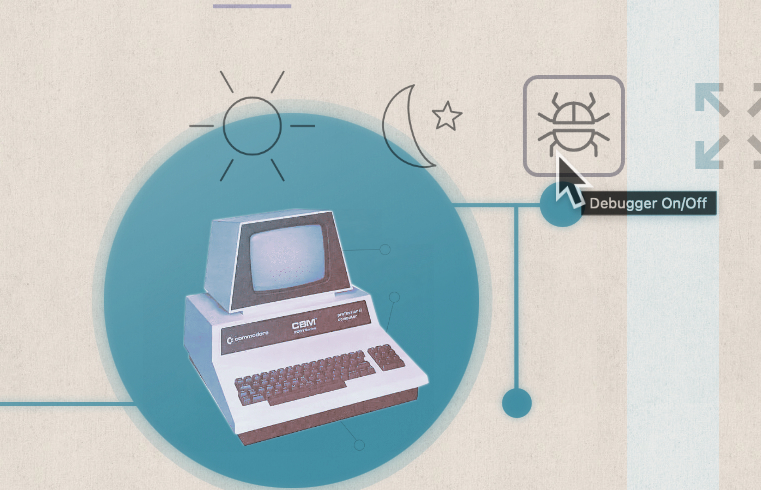
So a few words on the debugger for the PET 2001 emulator: this is meant to help you around with 6502 machine code on the virtual PET, both for exploring existing software and testing your own code. (Mind that the emulator features its own built-in drag-and-drop 6502 assembler and already a context sensitive disassembler and hex dump facilit, compare the “Utils/Export” menu. So we got you covered on all sides.) The debugger is a modular piece of software and may become even load-on-demand, one day. As indicated by the title illustration, the debugger is turned on and off by its icon on the top right of the screen.
Having said enough for “a few words”, be my guest on a visual tour.
We start with the top section with information relevant for the sate of the CPU and the current instruction:
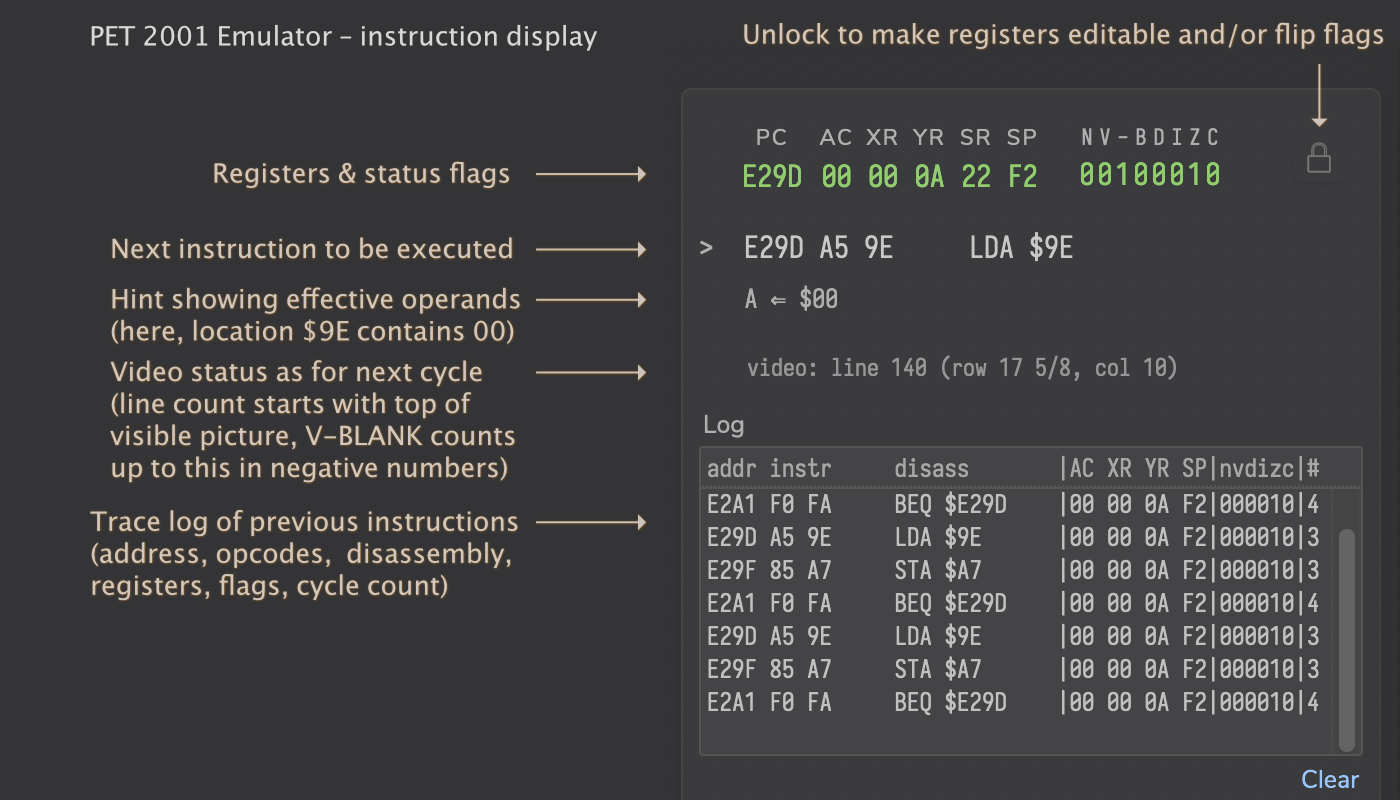
This and any of the following displays is only updated and interactive, when the emulated machine is halted. (Since, even for modern browsers, 1,000,000 fps at 1MHz may be still a bit too much asked for.)
You may edit the register contents and flip flags by a simple mouse click, but, in order to protect the innocent, this is hidden behind a lock icon to the right of the display for the CPU status.
This is followed by a section including anything related to the run and halt options:
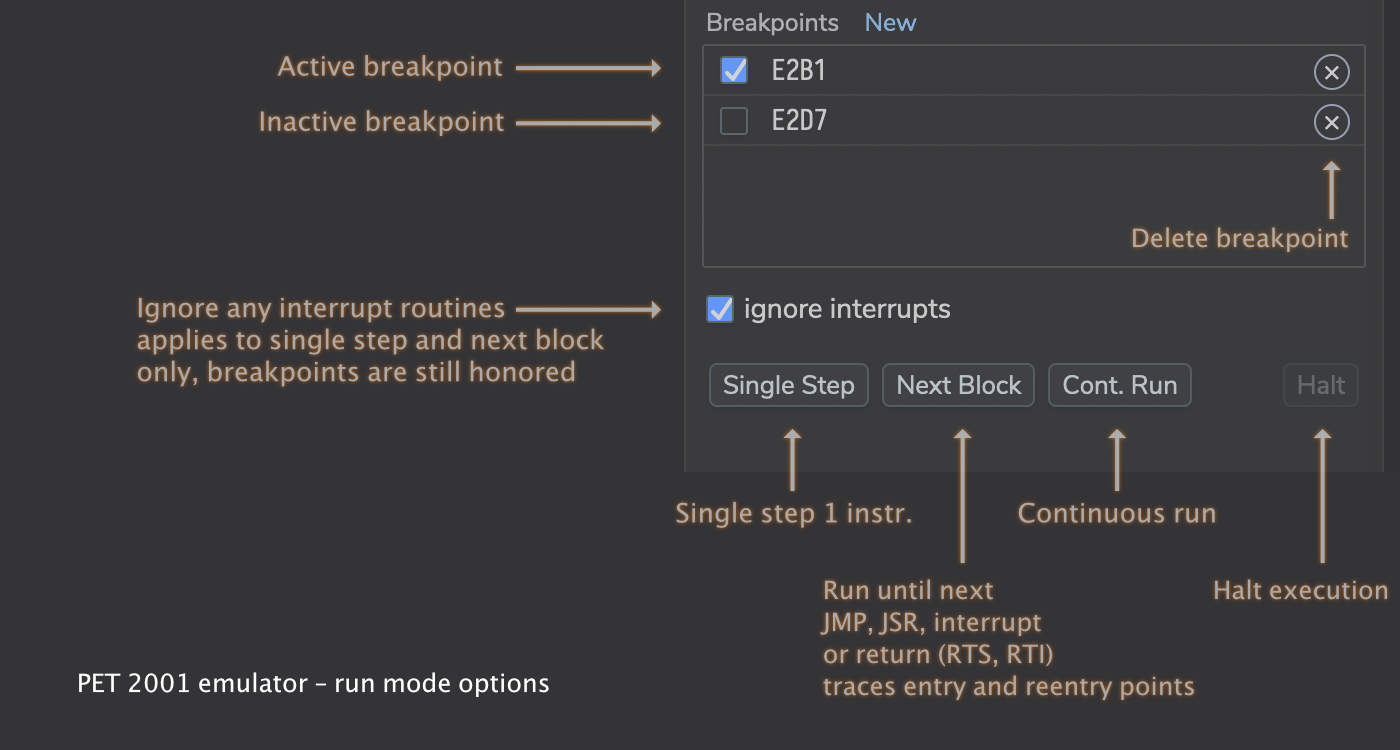
— A word on “ignore interrupts”: This excludes interrupt routines from traces and stepping, while still executing them. (Any active breakpoints in those routines will still trigger.) This option is default on, assuming that you may be more interested in following the main thread than in the wonders of the reoccurring system service interrupt routines.
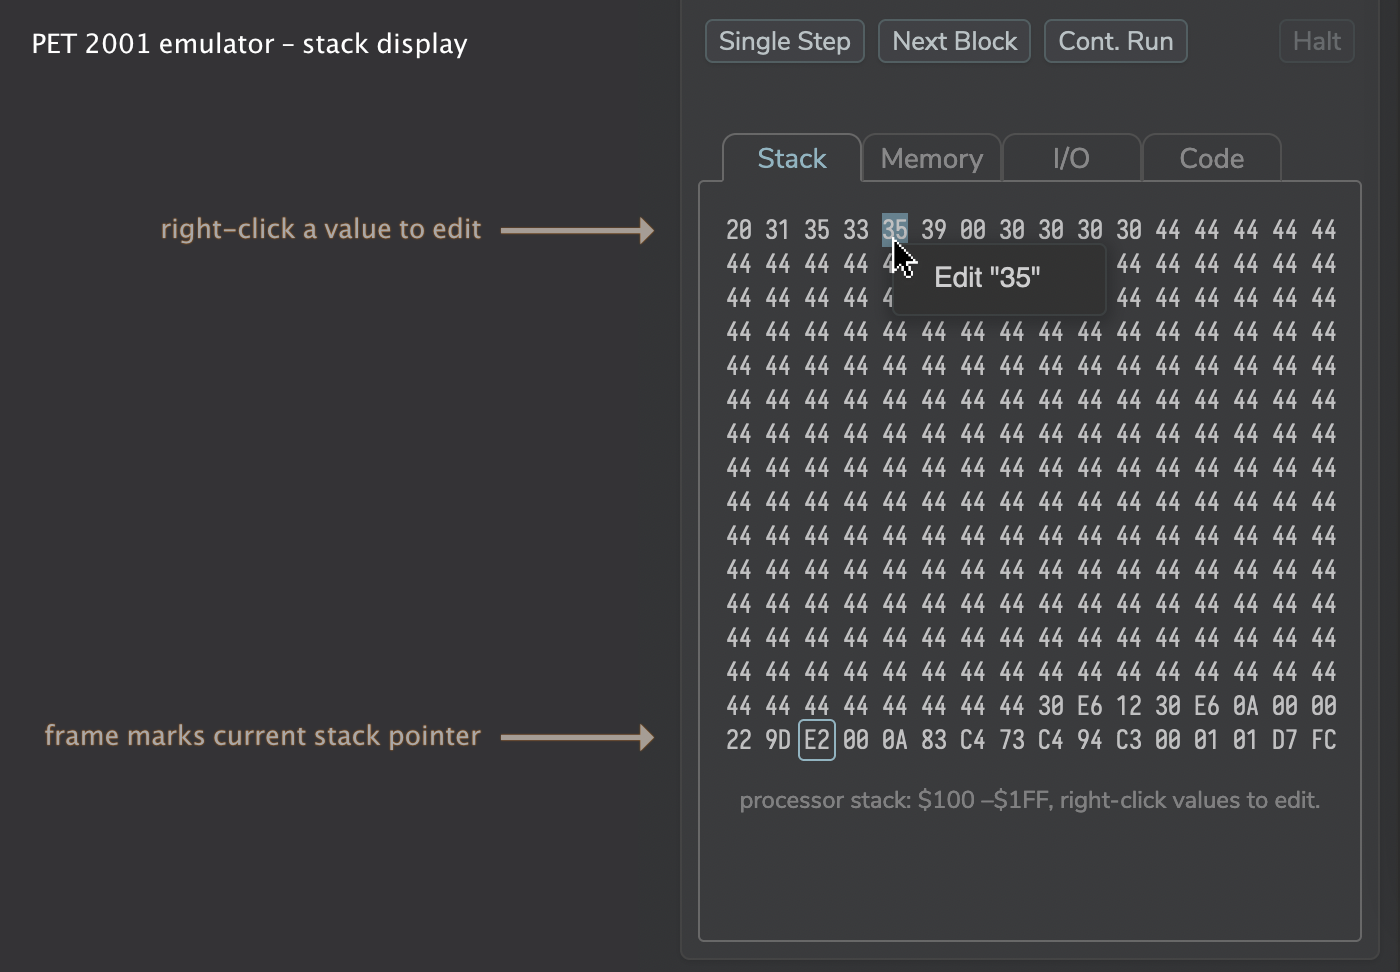
Below this is an area with tabbed displays regarding the machine status. The first one shows the entire processor stack (at $0100 – $01FF) at a glance. Edit is — again, to protect the innocent — behind a right click on any of the values.
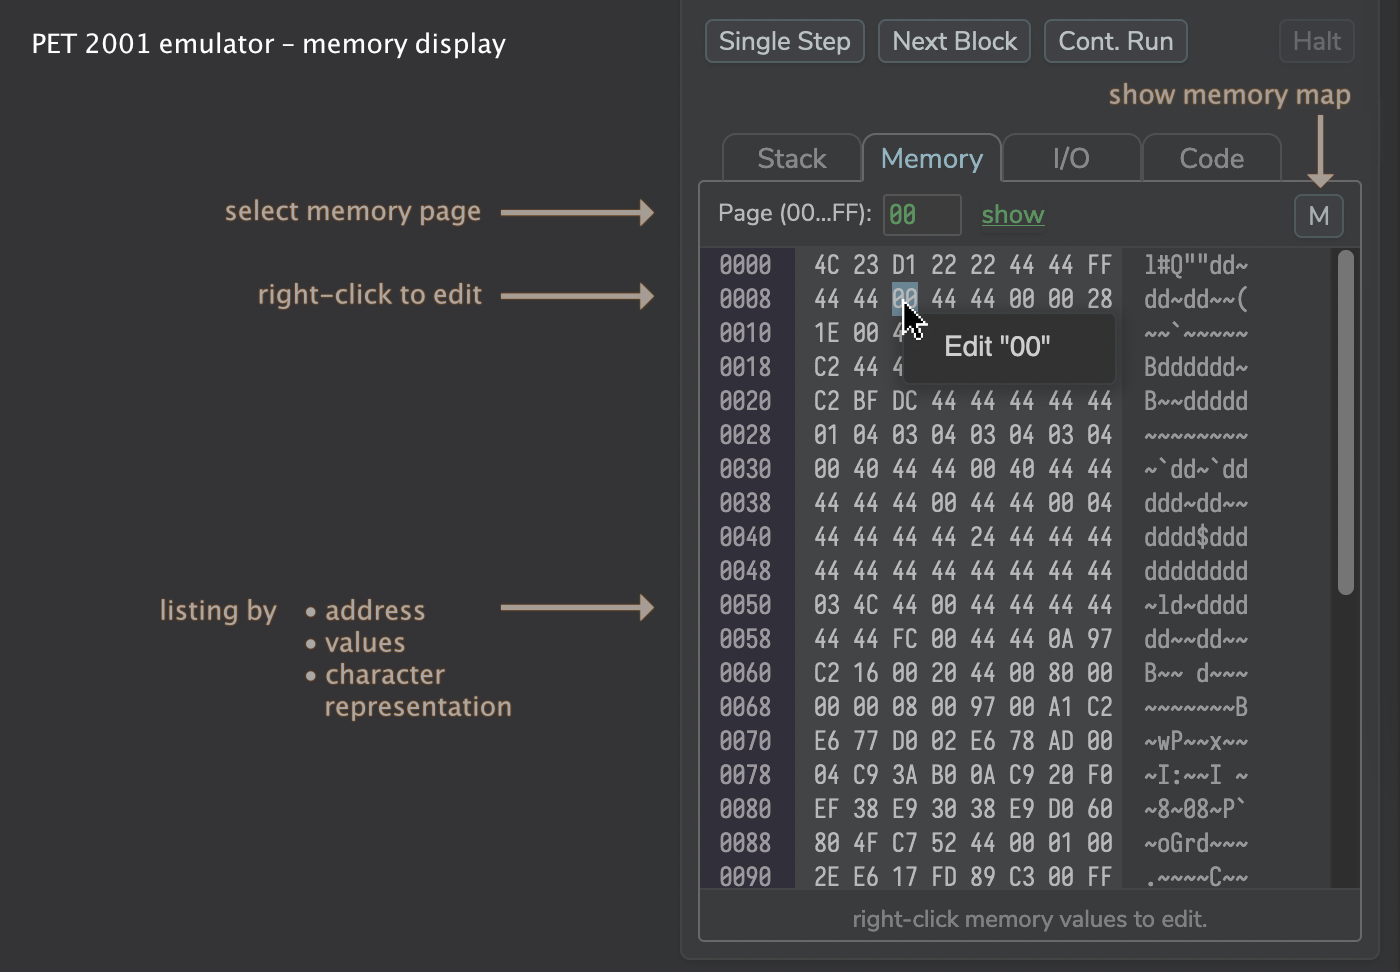
The memory tab allows you to inspect and edit any of the 256 address pages (at 256 bytes, each) of the emulated PET:
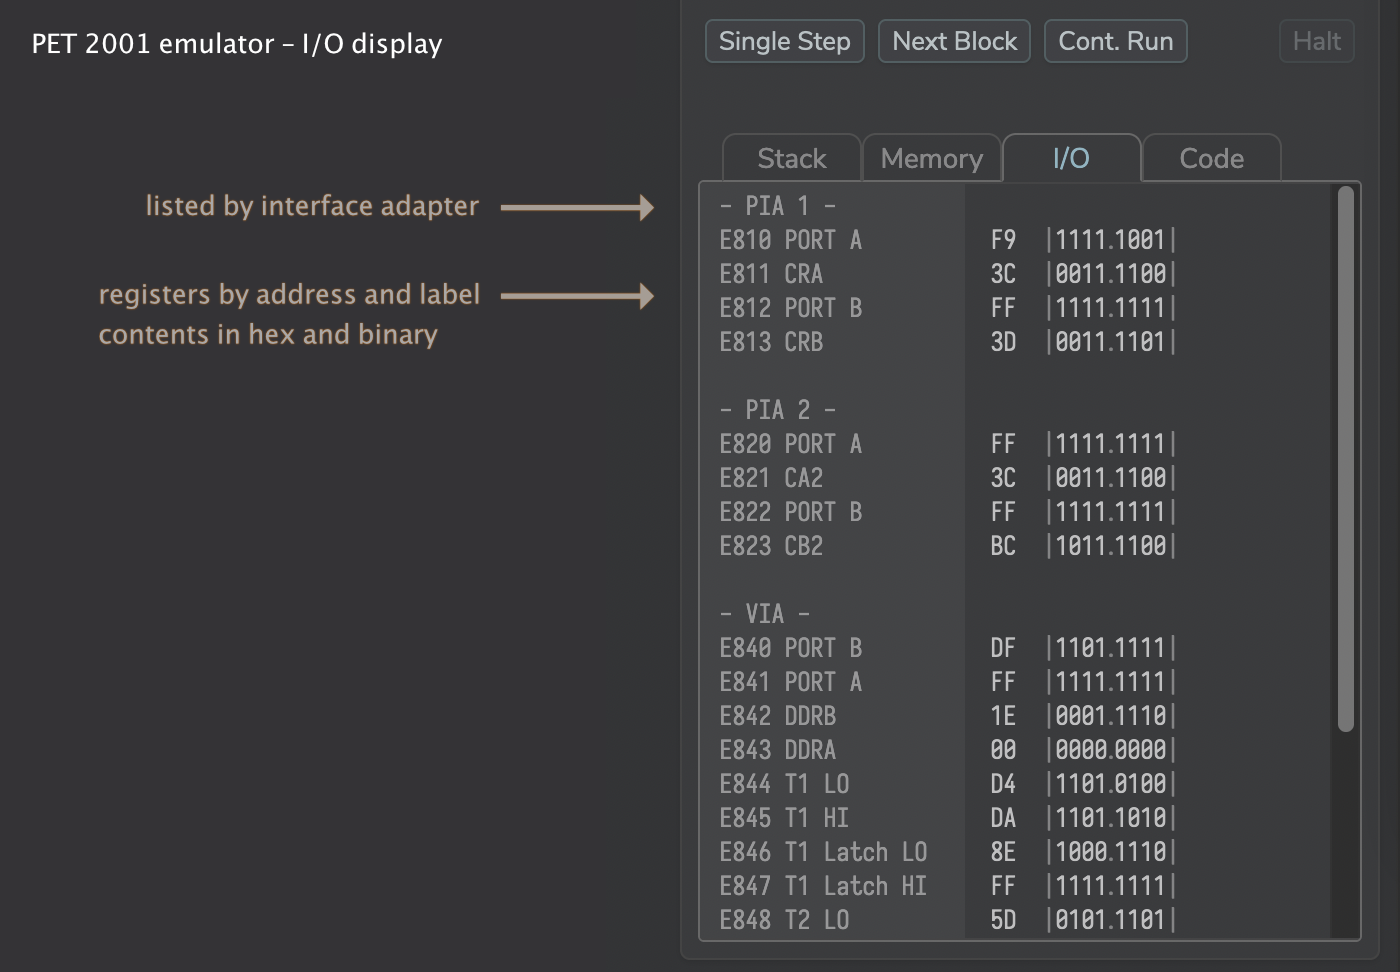
The I/O view lists the various I/O chips and their registers (without affecting said state):
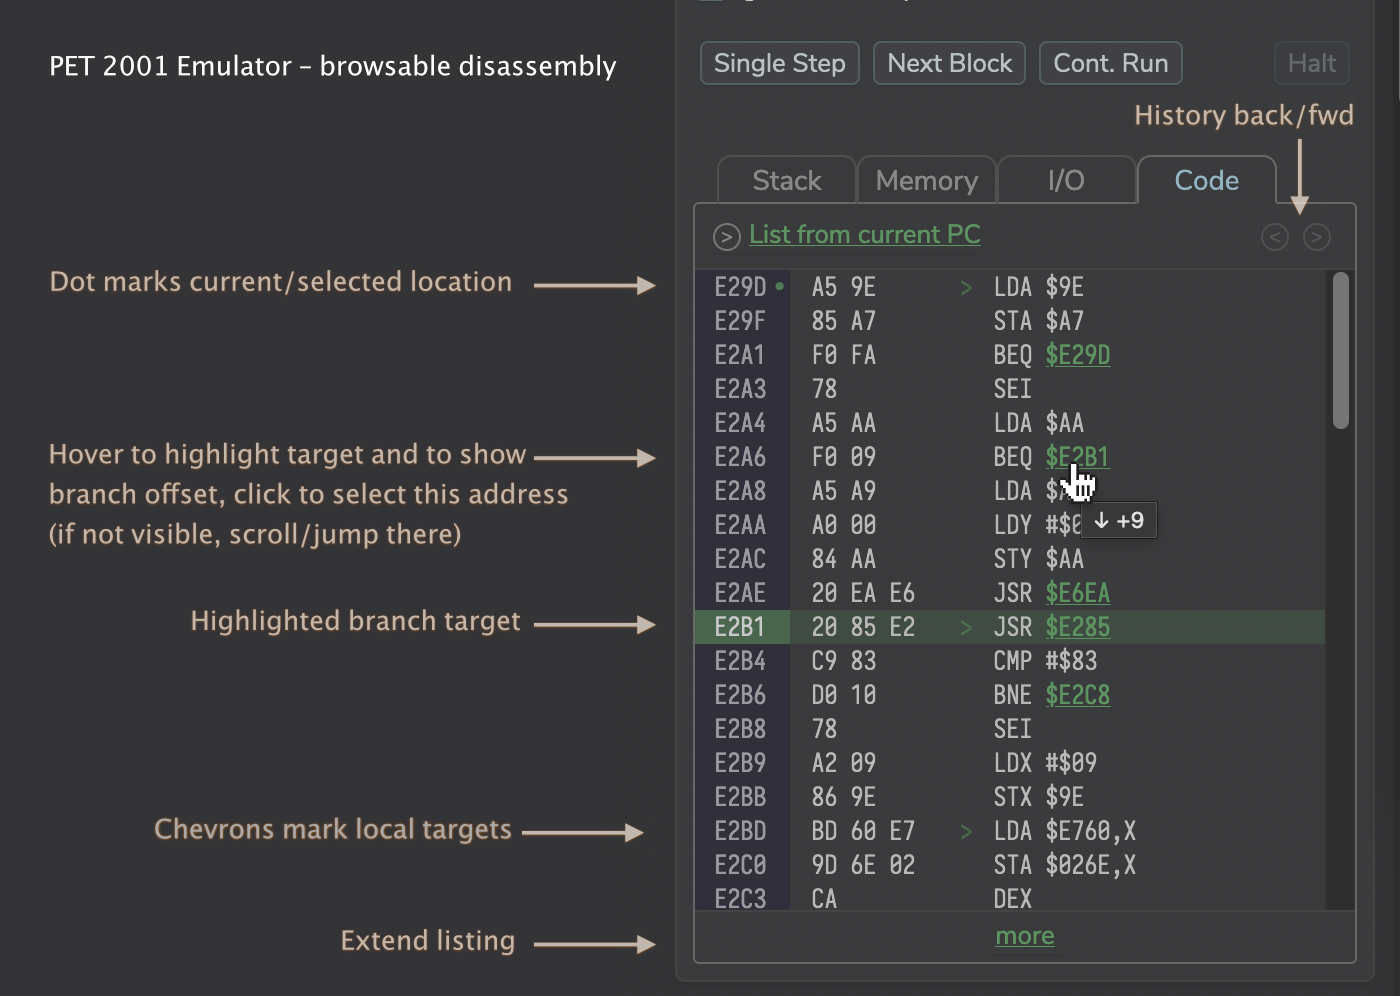
And, finally, the pièce de résistance, the browsable disassembly, showing the vicinity of the current instruction. While the trace log shows you what happened before, this one shows you what’s coming next:
Update:
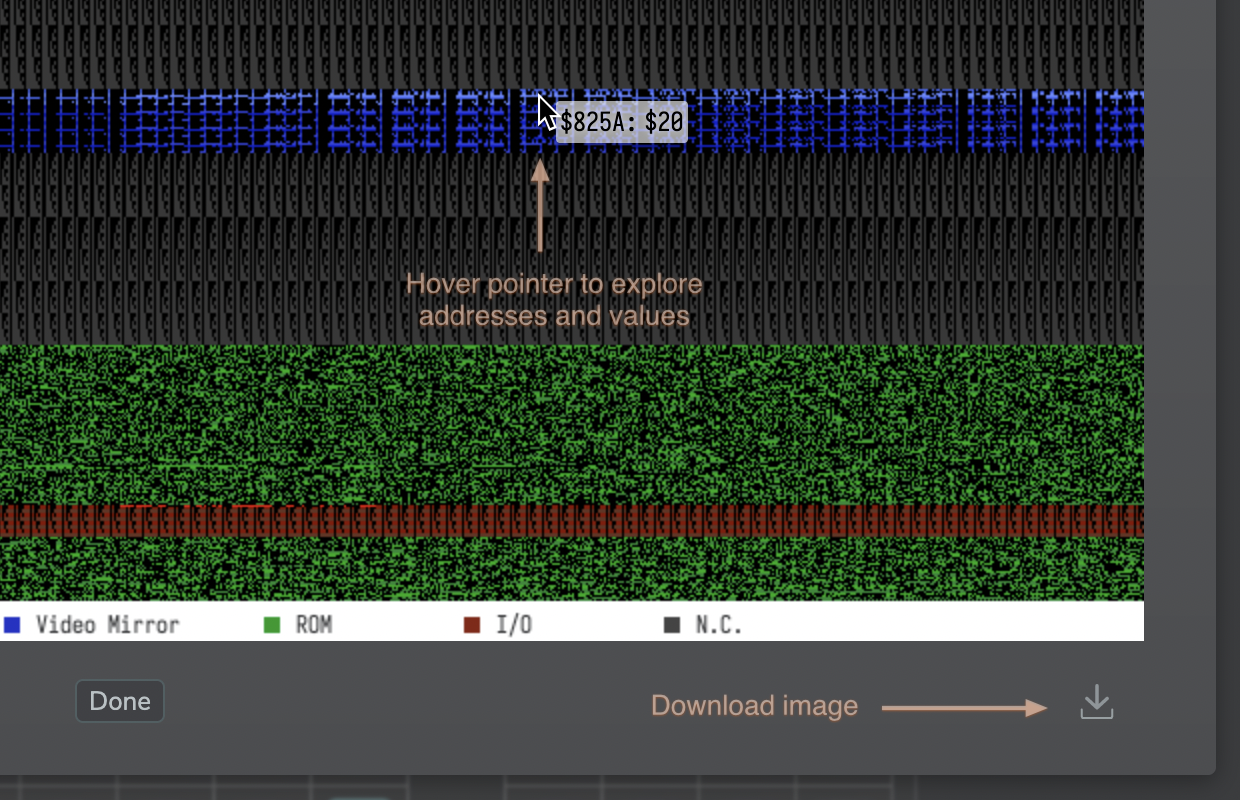
This is what the mysterious “M” button in the memory tab does, it displays a visual memory map, rendering each bit as a pixel. Here is what Space Invaders looks like (using 8K of a total RAM complement of 16K):
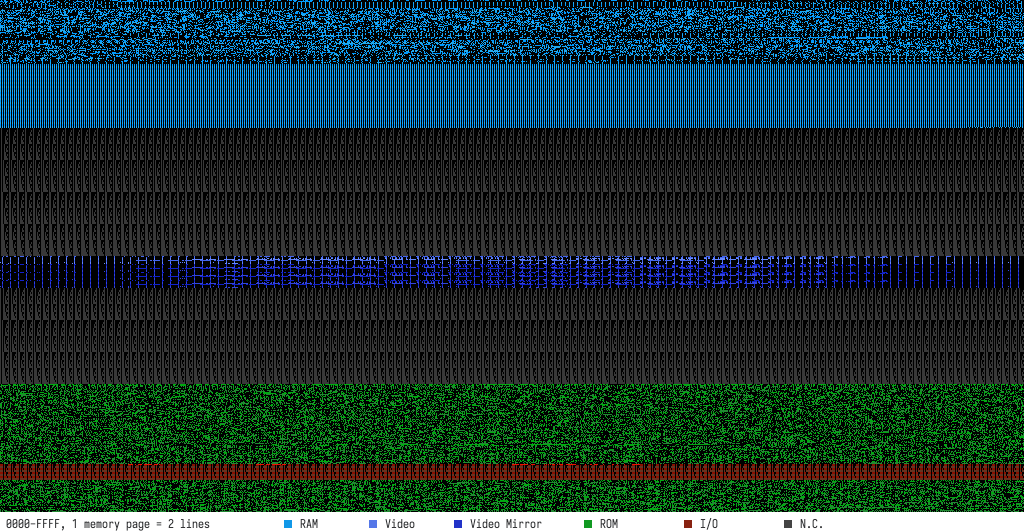
Click for a full size image (1024 × 532) to open in a new tab.
Move the mouse pointer over the map to explore addresses and values (while it may be difficult to point at individual bytes, it should be good enough to give you an idea) and you can also download the map as an image.
And this was our little tour. Any of these elements have convenient tool tips to help you find your way around, and should be rather self-explanatory, anyways.
Have fun!
Norbert Landsteiner,
Vienna, 2024-03-22
(Updated 2024-03-30)